- A matrix diagram, also known as a matrix chart, is a project management tool that helps with relationship investigation.
- The Matrix Chart shows relationships within a single group or between two, three, or four groups (Ex. project objective, methods, results, causes, people, etc.).
- It also contains details about the group's relationship strength and the roles that different group members perform.
- The relationship is then indicated by a number or symbol in each cell where the two items intersect in the matrix. A matrix diagram can be used as part of other decision making tools.
- Cause and Effect Matrix and Quality Function Deployment are examples of tools that use the matrix diagram

Matrix Diagram
Why use a Matrix Diagram?
- Project managers are in charge of a wide range of processes, people, and projects. Matrix chart aids in visualizing and recognizing the intricate relationship between the data sets.
- Matrix chart helps the management to organize data, prioritize resources, and make wise decisions to keep the projecton track
When to use a Matrix Diagram?
- Determine the cause of the problem
- Assigning resources based on their expertise and needs
- Comparing the outcomes of various alternatives
- Identifying areaswhereimprovements can be made
- Examining the requirement fulfillment
How to develop the Matrix Chart?
-
Determinethe objective
- Determine the relationship between the data sets and the intention of the matrix diagram. This will help in the selection of the team, data collection, and matrix chart. -
Choose a team
- Choose a team that is knowledgeable about the process as well as data collection. -
Determine the appropriate matrix diagram
- The team must choose the appropriate matrix chart and the type of symbols to determine the relationship between the groups based on the project's goal and data source. -
Plan and collect data
- The team must plan and collect accurate data for different data sets. -
Document the relationship between the groups
- The team must use suitable symbols or techniques to document the relationship between the groups and gain consensus among the team members. -
Make decisions
- Examine the groups' relationships and draw a conclusion based on the data. Although the matrix diagram is time-consuming, it is well worth the effort.
Types of Matrix Diagram
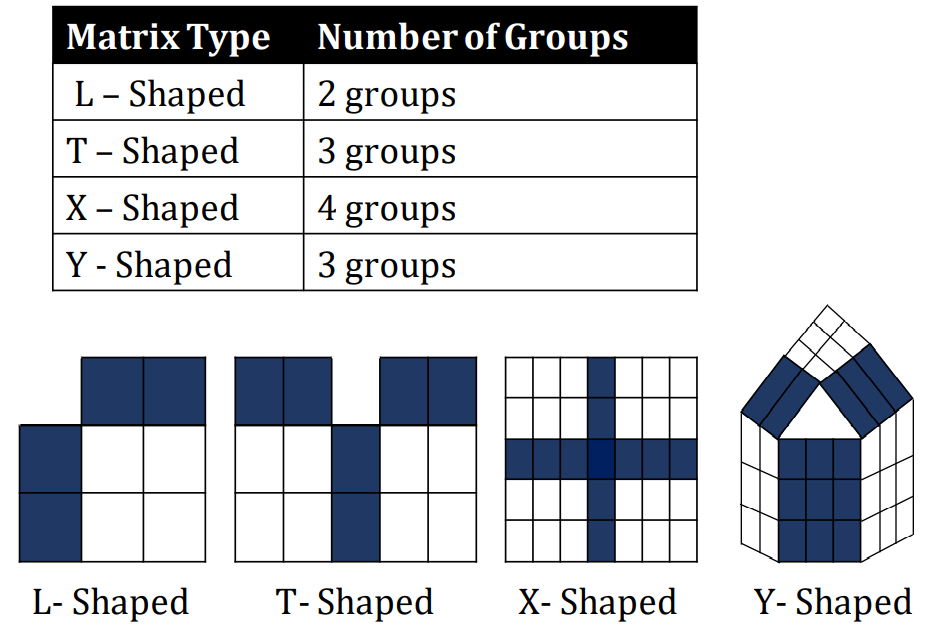
- The number of elements or groups to compare determines which matrix chart to use. L-Type, T-Type, X-Type, and Y-Type are some of the most common matrix diagrams
L - Shaped Matrix Diagram
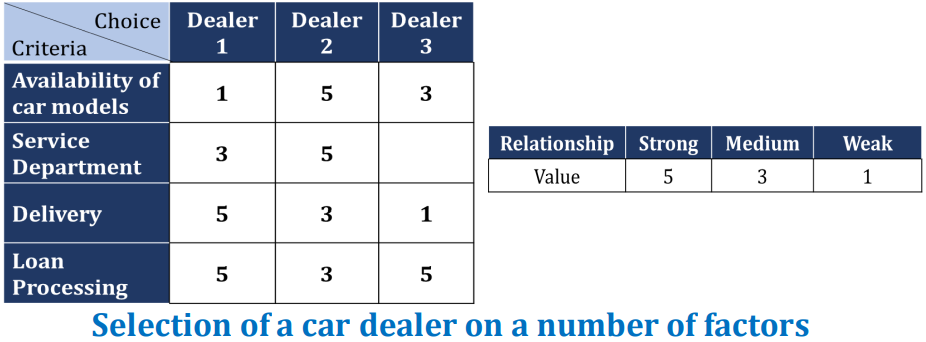
- The most simple and commonly used matrix chart for comparing only two data sets is the L-Type Matrix Chart. It's in the form of an upside-downversionofthe letter L.
- The L-Type Matrix chart is a two-dimensional table with one variable on the X-axis and another on the Y-axis that is used to compare only two sets of data or relationships within a single category.
- Use symbols to help you visualize the relationship between the elements in intersecting cells and indicate the relationship's strength.
- Weighting can also be used for prioritization and ranking. Other information can be displayed including: the totals and the overall strength of the relationshi
T - Shaped Matrix Diagram
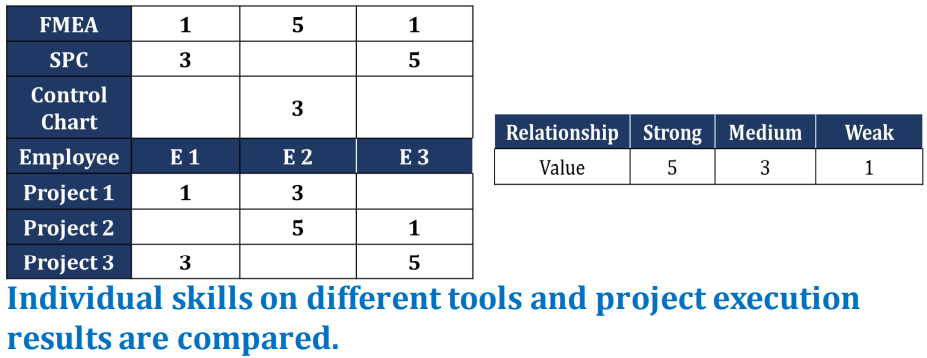
- The T-type matrix compares the two data sets with the third primary list, while the L-type matrix compares the two data sets with each other.
- On the Y-axis, there are two components. The Y-axis is divided by one factoron the x-axis.
- List the primary list in the center of the sheet (X-axis), one data set on the top side of the primary list (on the Y-axis), and another data set on the bottom side of the primary list(same on the Y-axis). Compare the relationship's strength to the primary list.
X - Shaped Matrix Diagram
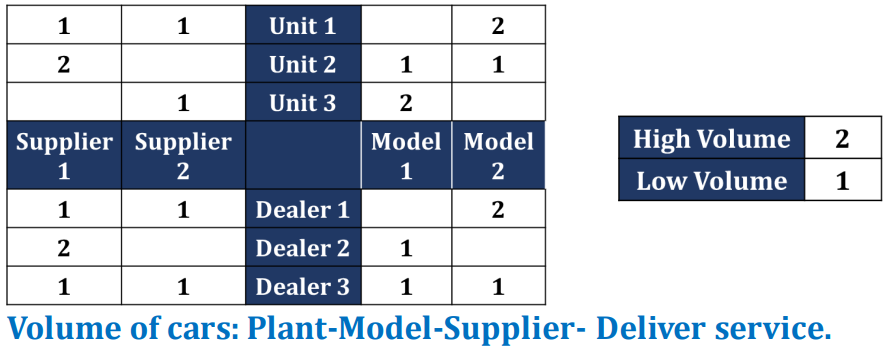
- The X-type matrix chart is a type of the T-type matrix chart that includes an additional data set.
- In most cases, an X-type matrix chart depicts the significant relationships between four data sets. Compare the interactions between adjacent groups.
- Place two sets of data on the Y-axis and two sets of data on the X-axis (middle of two Y-axis data sets)
Y - Shaped Matrix Diagram
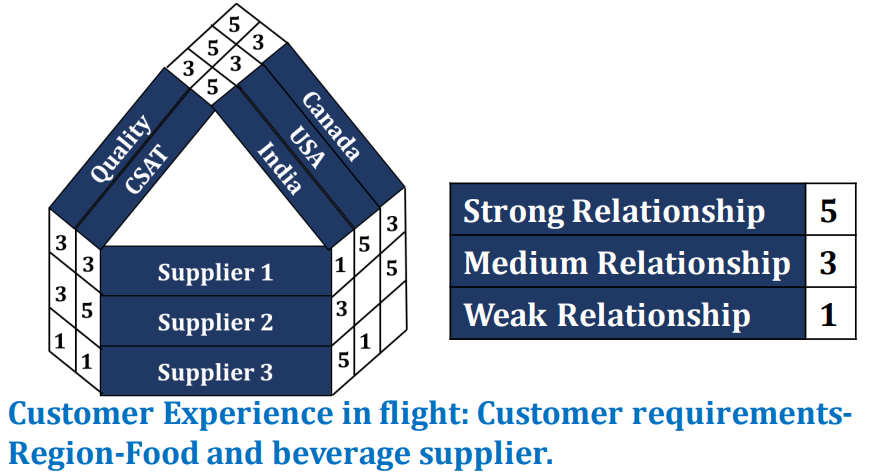
- The relationship between three groups of data sets is compared using a Y-type matrix chart.
- In a circular form, the Y-type matrix chart compares the three strongly groups.
- Y-Type Matrix chart is a 3-Dimensional grid with two L-Type matrices joined at the Y-axis.