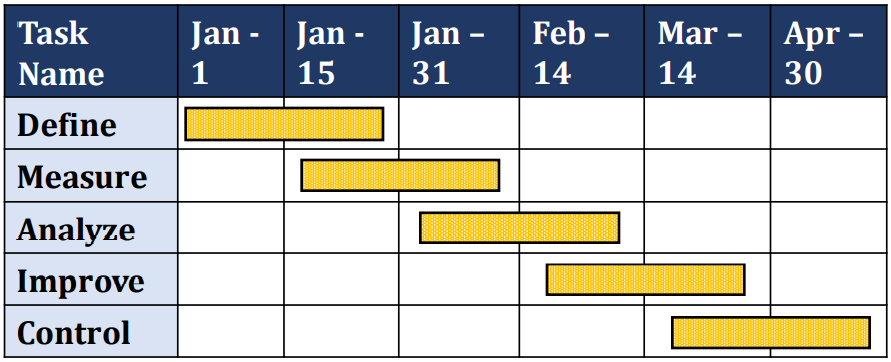
- A Gantt chart is a project management tool which illustrates a project schedule
- Gantt chart keeps track of task dependencies and displays the progress of theproject.
-
A Gantt chartillustrates:
- The tasks requiredfor the currentproject
- How long you expectthe projectto take
- Dependencies: in other words, any tasks that must be completed beforeothers can be started -
Gantt charts havetwo types of dependency:
- Tasks that depend on the output of other tasks.
- Tasks that depend on people who are also working on other tasks

Gantt Chart
Steps to Construct a Gantt Chart
- Break your project into phases and each phase down into tasks
- Assign each task to a person or small team
- Set an estimated amount of time for the task
- Note which tasks are dependent on others
- For each tasks; specify who’ll be doing the task; star and end dates; any dependencies on previous tasks
- List the days or weeks of the project across the top of the chart
- Block out the time period that each task is due to take up
- Check that dependent tasks don’t overlap
Notes to Remember on a Gantt Chart

- You may have overlapping tasks as long as they don't need the same resources or people or need input from each other’s output.
- You'll need to keep track of your Gantt chart up to date. Your team will rarely meet the target on time. They could complete tasks either early or late.
- There will be many dependencies on certain tasks. Particularly later on in a project.
Gantt Chart Advantages
- Easy to understand
- Can be constructed with minimal data
- Shows task progress vs date