- Variation are there everywhere, variation exists in humans, any systems, products, services & also processes
- Variation may be so small that it might not be possible to measure the amount of variation within the existing measuring equipment's accuracy
- Quantifying the amount of variation in a process is a critical step towards meeting customers’ needs
- Understanding the vital few causes of the variation helps us select actions to take to achieve lasting improvement
- To study variation in a process, we use tools like Histogram and Run Chart

Variation
Variation Types
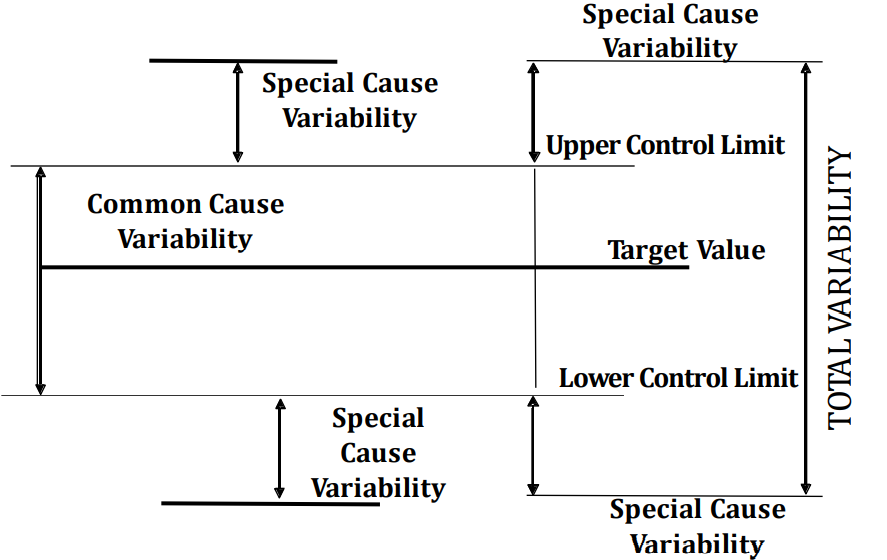
- Walter Shewhart developed the concept of separating variation into two distinct groups
-
Common Cause
Let the process Run
- Common cause variation is a variation from continuous uncontrolled changes in the process. These changes are usually small in nature and occur in random patterns. Other names areNatural variation, WhiteNoise.
- Naturalto the process
- Occurs regularly (Random)
- If such a thing exists, you can live with it -
Special Cause
Investigate – corrective action necessary
- Special cause variation is a variation from the periodic uncontrolled changes in the process. These changes are usually large in nature and occur in non-random patterns. Other names are Assignable cause variation, Black Noise
- Causes non-random process performance
- Unacceptable to maintain desired process performance
- Usually caused by human error or system failure
Common Cause & Special Cause
- Special causes are the most probable reasons if the process/ measurement shows instability
- Special causes are also called Assignable causes as they can be assigned to a particular deviation
Special Cause Conditions
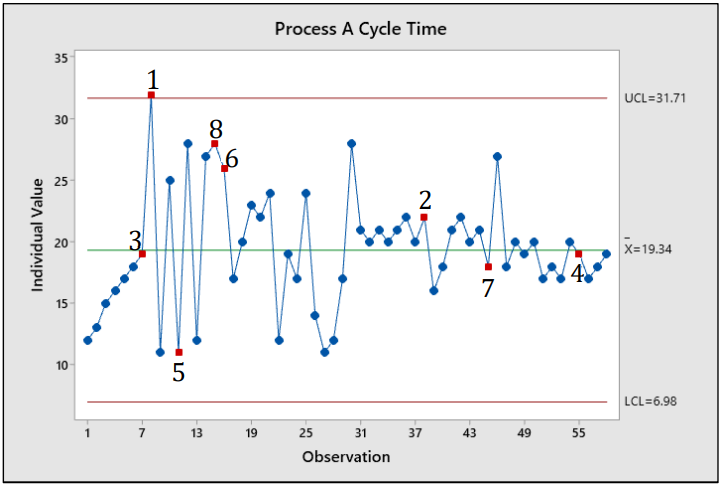
- If one or more points fall outside of the upper/lower control limit (UCL). Test 1 is universally recognized as necessary for detectingout-of-control situations.
- Nine points in a row on the same side of the center line. Test 2 identifies shifts in the process centeringor variation.
- If there is a run of six or more points that are all either increasing or decreasing . Test 3 detects trends. This test looks for a long series of consecutive points that consistently increase in valueor decreasein value.
- Fourteen points in a row, alternating up and down. Test 4 detects systematic variation. You want the pattern of variation in a process to be random, but a point that fails Test 4 might indicate thatthe pattern of variationis predictable.
- If two out of three successive points fall in the area that is beyond two standard deviations. Test 5 detects small shifts in the process.
- If four out of five successive points fall in the area that is beyond one standard deviation from the mean, either above or below. Test 6 detects small shifts in the process
- If 15 points in a row fall within the area on either side of the mean, that is one standard deviation from the mean. Test 7 detects a pattern of variation that is sometimes mistaken as evidence of good control. This test detects control limits that are too wide. Control limits that are too wide are often caused by stratified data, which occur when a systematic source of variationis presentwithin each subgroup.
- If eight points in a row more than 1σ from center line (either side). Test 8 detects a mixture pattern. In a mixture pattern, the points tend to fall away from the center line and instead fall near the controllimits.